

Home > Identify unknowns in your attack surface and address shadow IT

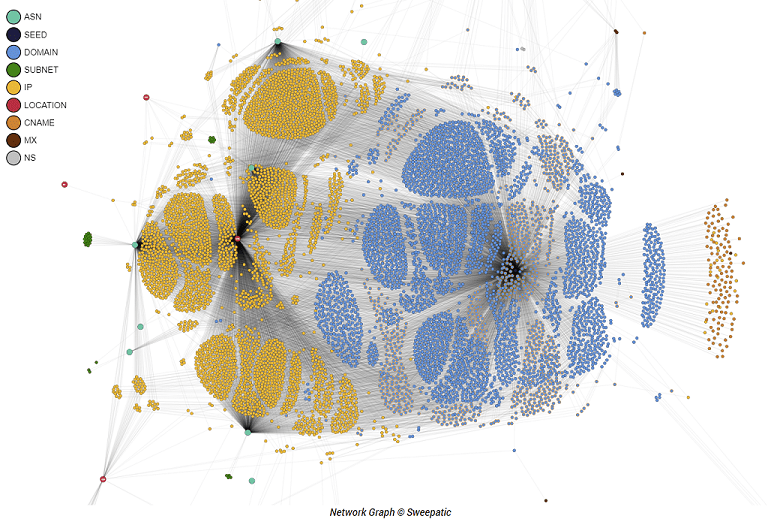
What does your online footprint look like from the outside? Our network graph shows the interconnectivity in your online infastructure and displays how your internet-facing assets are related. This allows you to discover outliers, to consolidate your cloud providers and to see where your assets are located in the world.
Attack surface reduction is the next step. The Sweepatic Platform helps you to analyze and clean up your attack surface, making it lean and unattractive to cyber attackers.
Why is it important?
Due to digital transformation, the attack surface of organizations grows steadily. The number of internet-facing assets, like websites, subdomains, technologies and cloud resources, increases at a rapid pace.
And don’t forget about shadow IT: quite some IT assets in organizations escape the knowledge or attention of the central IT department. According to Gartner, it comprises 30-40 percent of IT spending. Shadow IT consumes budget unnecessarily and increases security risks, that is vulnerabilities might not be tracked or managed.
Furthermore, the global Covid-19 pandemic also adds a risk to your cyber health. As more employees work from home, more online assets and shadow IT pops up in your attack surface. According to InfoSecurity Magazine, organizations report an increase of detected online threats and confirm that home workers using shadow IT represent a major problem.
Create visibility & track
To counter the increase in cost and increase in security risk taking internet-facing assets offline, moving them to a different geolocation, consolidating, fixing misconfigurations and addressing policy violations are actions to take.
Where to start?
The Sweepatic Platform offers visibility, asset tracking, analysis and prioritization. Our network graph provides a first view where to start the clean-up of your attack surface by discovering outliers, mapping cloud providers and locations. And as your time is precious, the Platform does it all automatically.
Discover Outliers
The network graph shows how your seed domains, subdomains, IP addresses, subnets, DNS records and locations are linked. It is a visual how your attack surface actually looks like. Think of it as a photograph of your online presence. In this way you can discover ‘rogue’ assets; outliers that might not be in line with your security policy or should not be a part of your online footprint any longer.
Consolidate Cloud Providers
While the Sweepatic Platform serves primarily to help keep your organization safe from cyber attackers, it can also help save you money.
As a result of the move to the cloud, we often see that attack surfaces are swarmed with different and many cloud providers. Based on the overview created by the Sweepatic Platform, you can assess outlier cloud providers and the internet-facing assets linked to them, and save money by consolidating or removing them.
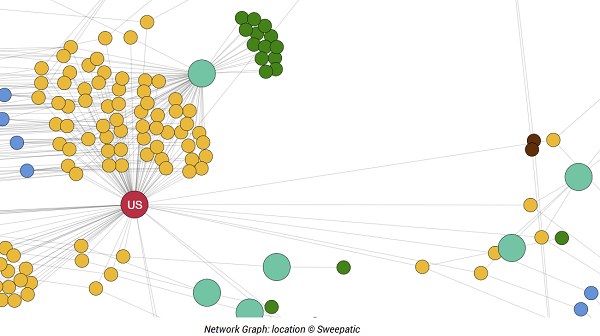
Find Asset Locations
Which hosts are residing where in the world? You can find the answer with one look at the network graph. What if, for example, two internet-facing assets are located in Romania while the rest of them is clustered in the USA? You might consider validating the business justification for this.
Contact us
We at Sweepatic are continuously engineering new use cases for our Sweepatic Platform to support our customers in running successful attack surface management programs. Subscribe to our newsletter to stay in the loop!
So if we sparked your interest and you would like more, don’t hesitate and reach out to us via info(at)sweepatic.com or ping us via our social media channels.
For a free trial of the Sweepatic Platform click here!